
 Facebook
 X
X
 Pinterest
 Copy Link
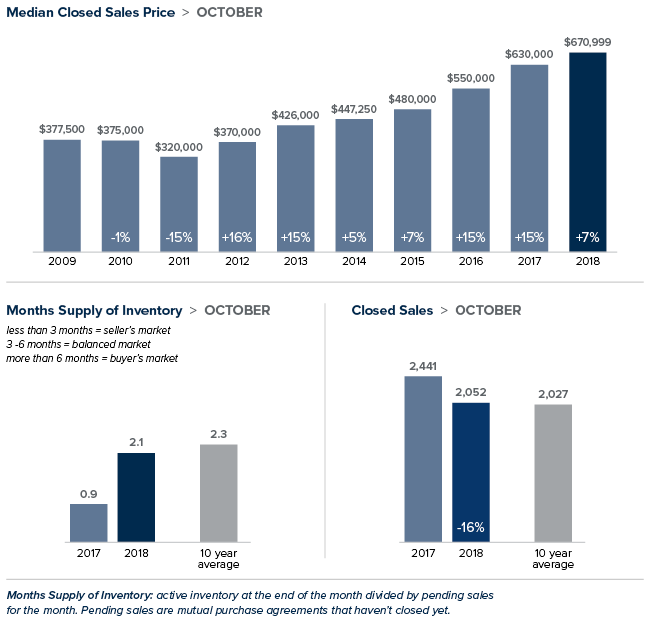
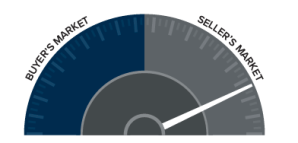
Increased inventory, slower sales and more price reductions all point to a balancing market—welcome news for price-shocked buyers. Sales prices are up from last October and down from the all-time high reached this spring. Despite the slowdown, it’s important to point out that we’re only moving back toward what a normal market looks like. King and Snohomish counties each have over two months of available inventory. While that is double the inventory of a year ago, it’s far short of the four to six months supply that is considered a balanced market. Sellers looking to list their home now can be sure there remains plenty of interest among home buyers.
King County

>>>Click image to view full report.
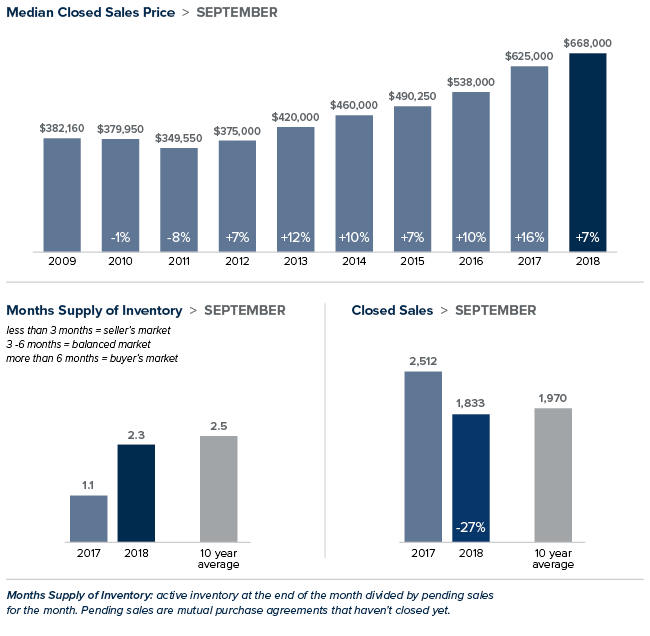
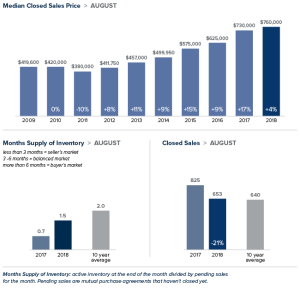
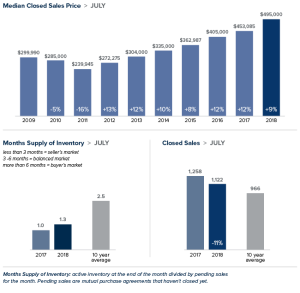
Inventory in King County for all homes, both single-family and condominium, soared 102 percent over last October. The increase was due to an influx of new listings and the fact that homes are now taking longer to sell than at the peak of the market this spring. While buyers now have more breathing room to make their decisions, the 2.4 months of inventory in King County is still far from a balanced market. The median price of a single-family home in October was $670,999, an increase of 7 percent from the same time last year, and virtually unchanged from August and September. South King County showed larger increases, with prices rising more than 10 percent from a year ago in Auburn, Kent and Renton.
Eastside

>>>Click image to view full report.
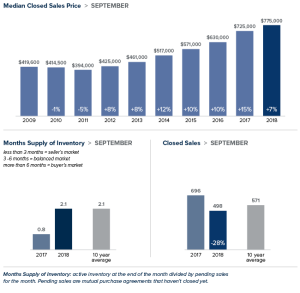
The median home on the Eastside sold for $890,000 in October, up 5 percent from a year ago and unchanged from the previous month. While year-over-year price increases were in the single digits for the Eastside overall, several areas, including Kirkland, Woodinville and Mercer Island, experienced double-digit price gains. Buyers are still having to pay a premium for desirable Eastside properties. However, with more choices and less buyer urgency, sellers need to price their home correctly to maximize their chances of getting the best possible return.
Seattle
>>>Click image to view full report.
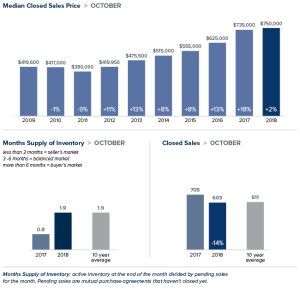
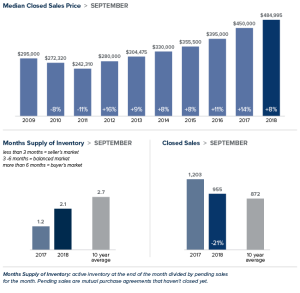
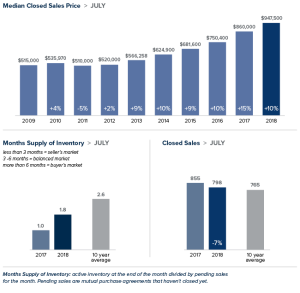
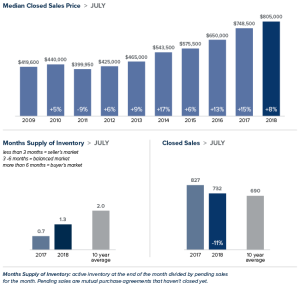
In October, the median price of a single-family home in Seattle was $750,000, up 2 percent from last October and down slightly from last month. While inventory doubled over a year ago, Seattle falls behind most areas of King County in supply with just under two months of inventory available. Demand is predicted to stay high, with Seattle’s population projected to grow at twice the national rate next year. That said, buyers are in the position to be able to negotiate. A recent analysis named Seattle as one of the top markets in the country where it makes the most sense to buy this winter.
Snohomish County

>>>Click image to view full report.
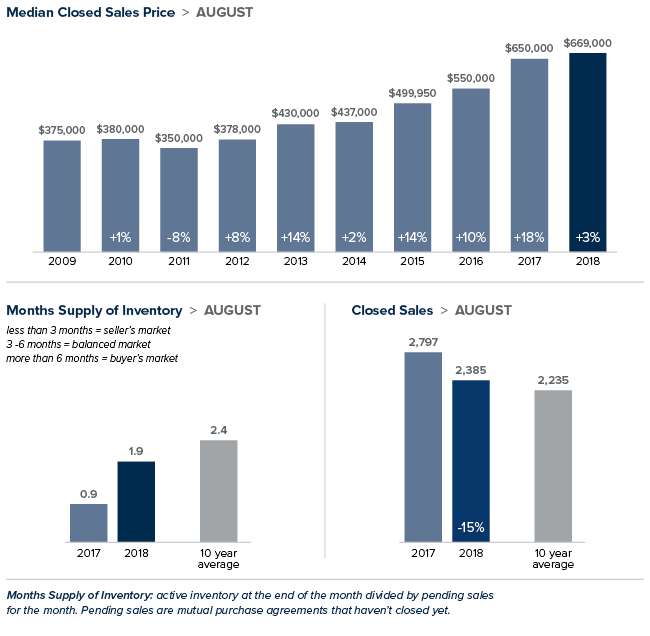
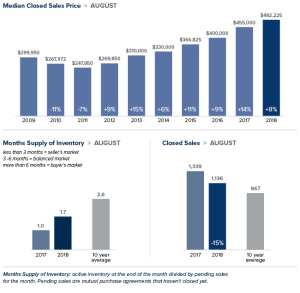
Inventory in Snohomish County soared 65 percent in October as compared to a year ago. The area now has 2.4 months of inventory, about the same relative supply as King County. As with most of the Puget Sound area, the increase in inventory was due to a higher number of sellers listing their homes and fewer sales. Year-over-year, the median price of a single-family home sold in October in Snohomish County grew 8 percent to $473,000. The median price in September was $485,000.
This post originally appeared on the Windermere Eastside Blog.


 As inventory levels start to rise, some of the heat has been taken off the market, which caused home prices in the Western Washington region to go up by a relatively modest 6.2% over last year to $503,039. Notably, prices are down by 4.4% when compared to the second quarter of this year.


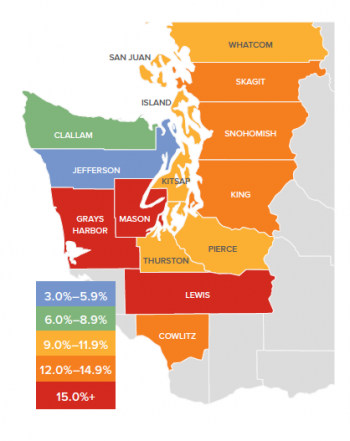 As inventory is still fairly scarce, growth in home prices continues to trend well above the long-term average. Prices in Western Washington rose 12.2% over last year to $526,398.


 Gardening– It’s not too late to start your garden! If you’re thinking of getting your green thumb engaged, just make sure you use starts because many summer harvest vegetables won’t start from seed this late in the season.
 Air it out- Open all the windows, shake out the rugs and update home fragrances to fit summer moods (citrus, freesia, clean linen, coconut, melon, fruits and tropical, etc.). You can