gardner report May 1, 2019

The Gardner Report – First Quarter 2019

The following analysis of the Western Washington real estate market is provided by Windermere Real Estate Chief Economist Matthew Gardner. We hope that this information may assist you with making better-informed real estate decisions. For further information about the housing market in your area, please don’t hesitate to contact us.

ECONOMIC OVERVIEW

Washington State employment slowed to an annual growth rate of 1.7% — a level not seen since 2012 — and continues a trend of slowing that started in the summer of 2018. I was a little surprised to see such a significant drop in employment growth, but it may be due to the state re-benchmarking their data (which they do annually). As such, I am not overly concerned about the lower-than-expected numbers but will be watching to see if this trend continues as we move through the spring months. The state unemployment rate was 4.5%, marginally below the 4.6% level a year ago.

My latest economic forecast suggests that statewide job growth in 2019 will be positive but is expected to slow. We should see an additional 84,000 new jobs, which would be a year-over-year increase of 2.2%.
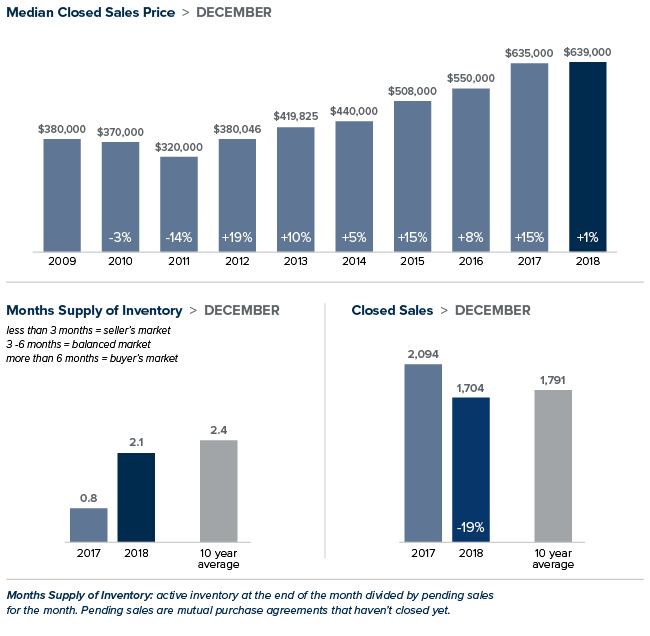
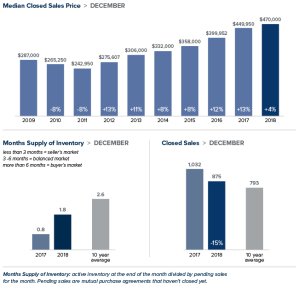
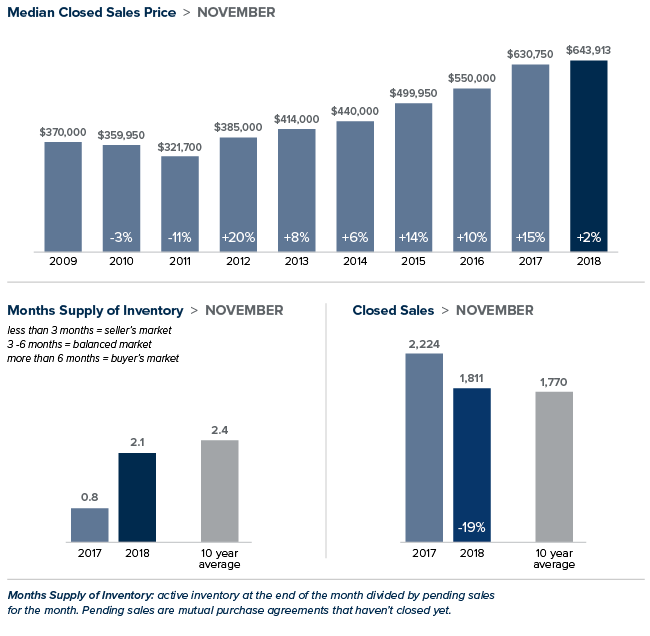
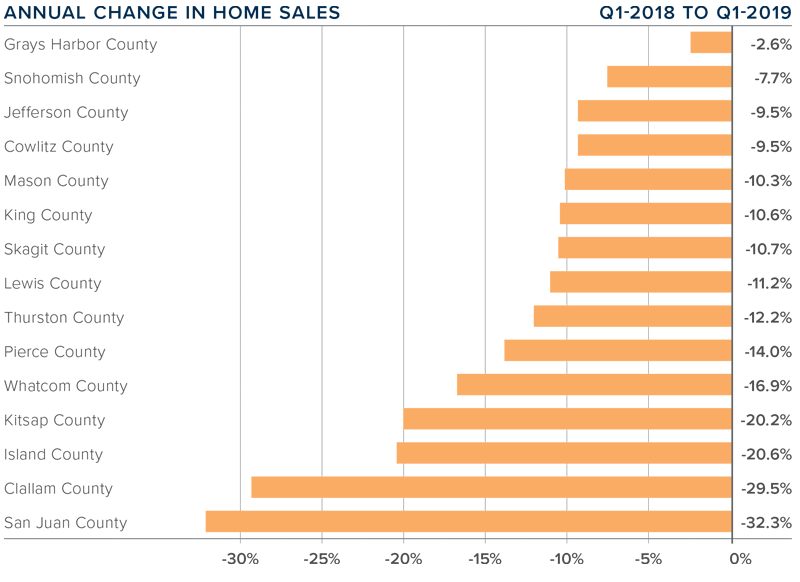
HOME SALES

  • There were 13,292 home sales during the first quarter of 2019. Year-over-year, sales were down 12.3% and were 23.4% lower than the fourth quarter of 2018.
  • It is quite likely that part of the slowdown can be attributed to the very poor weather in February. That said, anecdotal information from our brokers suggests that March was a very active month and I expect to see sales rise again through the spring selling season. Notably, pending home sales were only off by 3.5% from the first quarter of 2018.
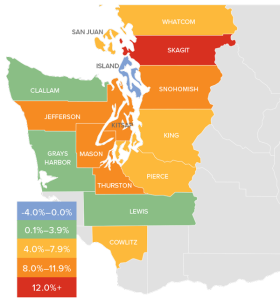
  • All counties contained in this report saw sales drop when compared to a year ago. The greatest drops were in the relatively small counties of San Juan, Clallam, Island, and Kitsap.
  • The decline in interest rates during the first two months of the quarter nudged many home buyers off the fence. I believe this will cause a significant bump in sales activity in the second quarter numbers.
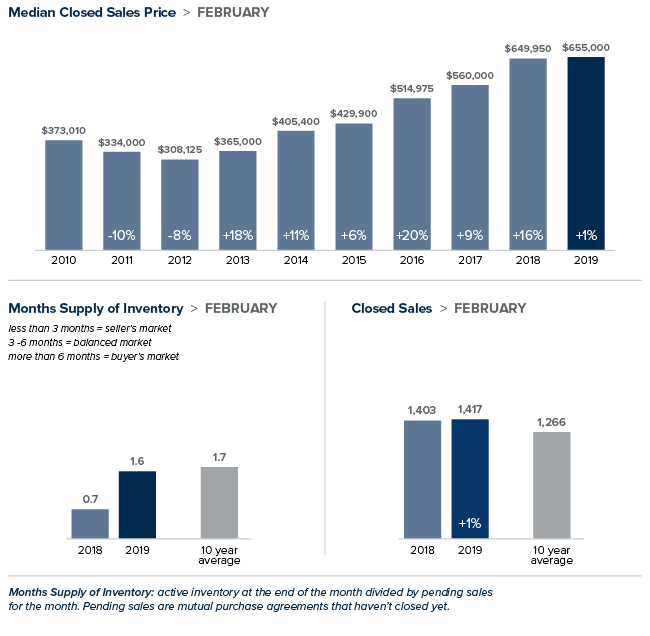
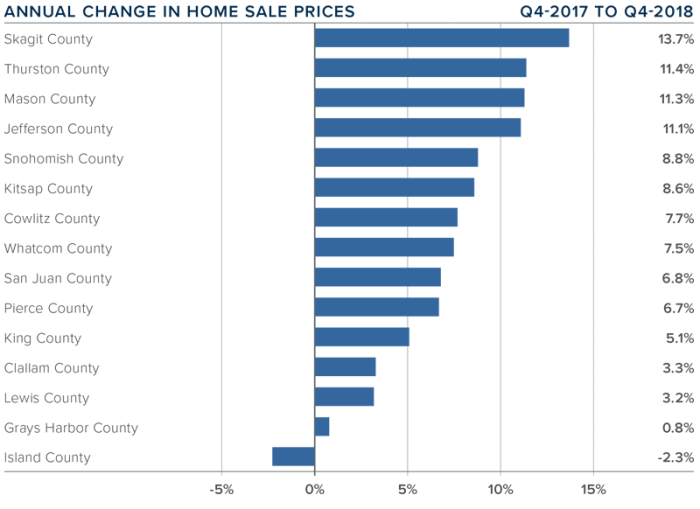
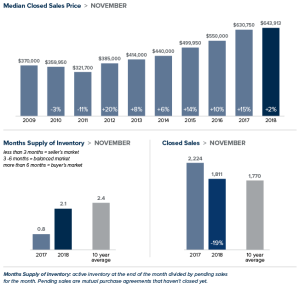
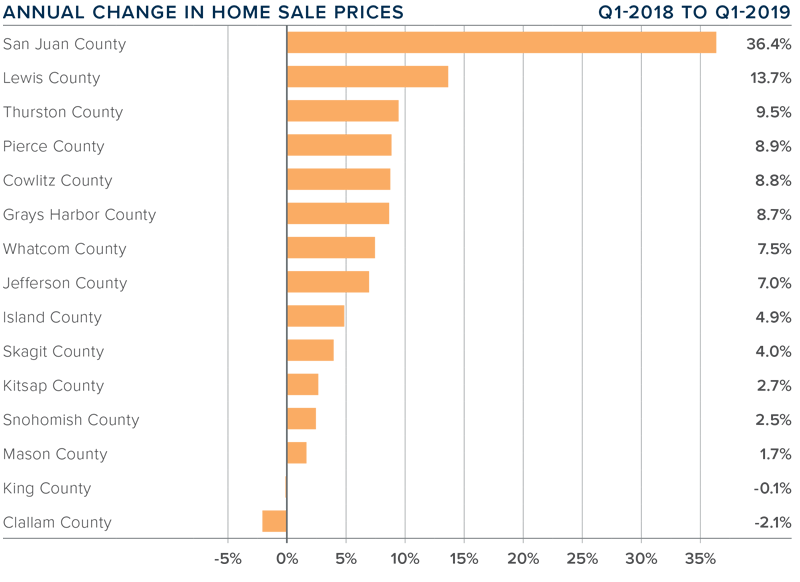
HOME PRICES


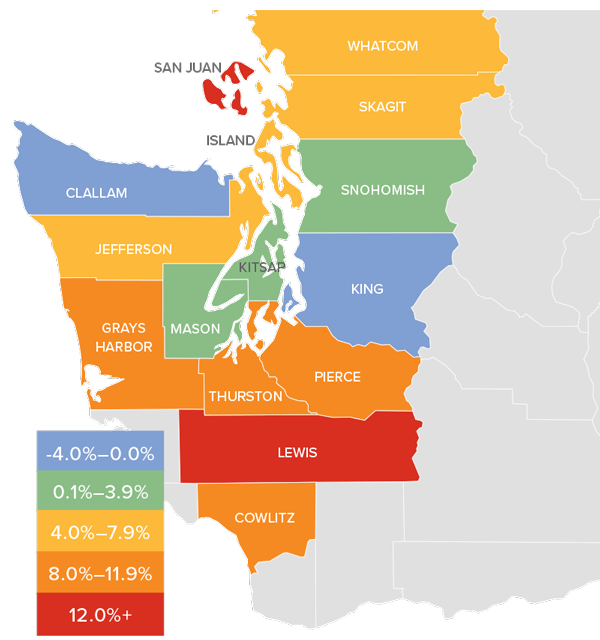
  • In combination with the factors discussed earlier, the 40% increase in listings has caused home price growth to taper to a year-over-year increase of 3.3%.
  • Home prices were higher in every county except Clallam. While the growth of prices is slowing, the strong local economy, combined with lower interest rates, will cause home prices to continue rising through 2019.
  • When compared to the same period a year ago, price growth was strongest in San Juan County, where home prices were up 36.4%. Only one other county experienced a double-digit price increase.
  • As I have said for quite some time now, there must always be a relationship between incomes and home prices, and many areas around Western Washington are testing this ceiling. That said, the region’s economy continues to perform well and incomes are rising, which, in concert with low interest rates, will allow prices to continue to rise but at a significantly slower pace.
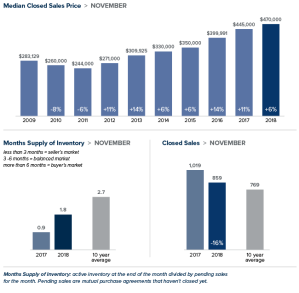
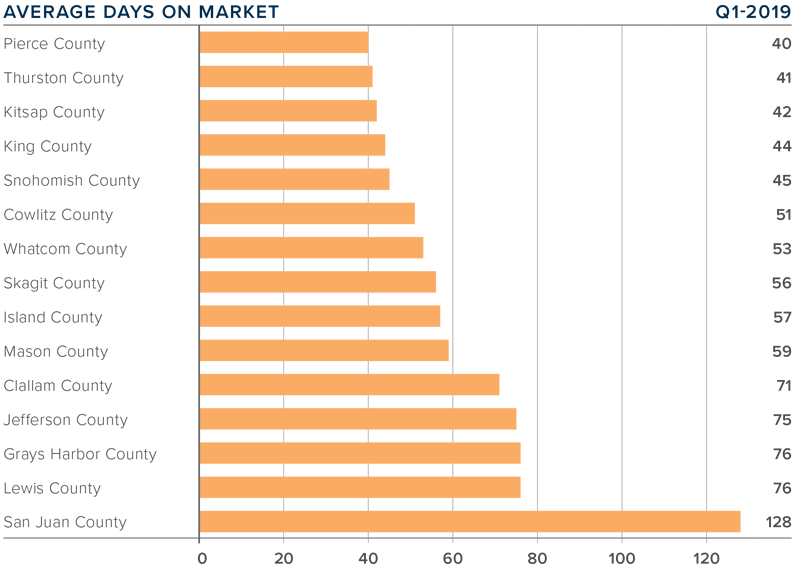
DAYS ON MARKET

  • The average number of days it took to sell a home matched the same quarter of 2018.
  • Pierce County was the tightest market in Western Washington, with homes taking an average of 40 days to sell. There were seven counties that saw the length of time it took to sell a home drop compared to the same period a year ago. Market time rose in seven counties and one was unchanged.
  • Across the entire region, it took an average of 61 days to sell a home in the first quarter of 2019. This matches the level seen a year ago but is up by 10 days when compared to the fourth quarter of 2018.
  • In the last two Gardner Reports, I suggested that we should be prepared for days-on-market to increase, and that is now occurring. Given projected increases in inventory, this trend will continue, but this is typical of a regional market that is moving back toward balance.

CONCLUSIONS

This speedometer reflects the state of the region’s real estate market using housing inventory, price gains, home sales, interest rates, and larger economic factors. I am again moving the needle toward buyers as price growth moderates and listing inventory continues to rise.

I do not see any clouds on the horizon that suggest we will see a downturn in sales activity in 2019. That said, this will be the year we move closer to balance. Buyers who were sidelined by the significant increase in listings in the second half of 2018 are starting to get off the fence as mortgage rates drop. I foresee a buoyant spring market ahead.

As Chief Economist for Windermere Real Estate, Matthew Gardner is responsible for analyzing and interpreting economic data and its impact on the real estate market on both a local and national level. Matthew has over 30 years of professional experience both in the U.S. and U.K.

In addition to his day-to-day responsibilities, Matthew sits on the Washington State Governors Council of Economic Advisors; chairs the Board of Trustees at the Washington Center for Real Estate Research at the University of Washington; and is an Advisory Board Member at the Runstad Center for Real Estate Studies at the University of Washington where he also lectures in real estate economics.

This post originally appeared on the Windermere.com Blog.

Local Market Update April 16, 2019

Local Market Update – April 2019

After months of softening, home prices began to rise in February. That trend continued in March. While prices in most areas were down from the same time last year, they increased over the prior month. New listings rose as well, offering buyers more options and more time to make the right choice. Despite the uptick in listings, inventory is still under two months of supply, far short of the three to six months that is considered balanced.

King County

>>>Click image to view full report.


The median price of single-family home in King County in March was $667,725. That figure was down 3% from the same time last year, but up from the $655,000 median price in February. The two areas that showed price increases year-over-year were the most expensive area in the county – the Eastside – and the least expensive – Southeast King County. The number of homes for sale was more than double that of a year ago, but still far short of enough to meet demand.

Eastside

>>>Click image to view full report.


Unlike most of King County, home prices on the Eastside grew over the prior year. The median price of a single-family home on the Eastside rose 3% to $950,000. That represents an increase of $50,000 over February. Amazon’s plans to relocate its worldwide operations team to Bellevue is expected to add thousands of employees to their Eastside campus and put even more demand on what is already tight inventory.

Seattle


>>>Click image to view full report.


The median price of a single-family home in Seattle hit $752,500 in March, down 8% from a year ago, but up $22,500 from February. Inventory rose 136% over last year. Despite the increase, new listings that were competitively priced saw many multiple and contingency-stripped offers.

Snohomish County


>>>Click image to view full report.


In Snohomish County, the median price of a single-family home grew 5.3% over last year to $500,000. That was an increase of $25,000 over February. A new passenger terminal at Paine Field is expected to provide a boost to the local economy and also lift demand for housing.

This post originally appeared on GetTheWReport.com.

buyinghousing market April 2, 2019

Find A New Home in Four Steps

Whether you’re a first-time homebuyer or a current owner looking for a bigger home, the ideas below will help you better navigate that all-important first step: Finding a property that you like (and can afford).

The search for a new home always starts out with a lot of excitement. But if you haven’t prepared, frustration can soon set in, especially in a competitive real estate market. The biggest mistake is jumping into a search unfocused, just hoping to “see what’s available.” Instead, we recommend you first take some time to work through the four steps below.

Step 1: Talk to your agent

Even if you’re just thinking about buying or selling a house, start by consulting your real estate agent. An agent can give you an up-to-the-minute summary of the current real estate market, as well as mortgage industry trends. They can also put you in touch with all the best resources and educate you about next steps, plus much more. If you are interested in finding an experienced real estate team in your in your area, reach out to us.

Step 2: Decide how much home you can afford

It may sound like a drag to start your home search with a boring financial review, but when all is said and done, you’ll be glad you did. With so few homes on the market now in many areas, and so many people competing to buy what is available, it’s far more efficient to focus your search on only the properties you can afford. A meeting or two with a reputable mortgage agent should tell you everything you need to know.

Step 3: Envision your future

Typically, it takes at least five years for a home purchase to start paying off financially, which means, the better your new home suits you, the longer you’ll most likely remain living there.

Will you be having children in the next five or six years? Where do you see your career heading? Are you interested in working from home, or making extra money by renting a portion of your home to others? Do you anticipate a relative coming to live with you? Share this information with your real estate agent, who can then help you evaluate school districts, work commutes, rental opportunities, and more as you search for homes together.

Step 4: Document your ideal home

When it comes to this step, be realistic. It’s easy to get carried away dreaming about all the home features you want. Try listing everything on a piece of paper, then choose the five “must-haves,” and the five “really-wants.”

For more tips, as well as advice geared specifically to your situation, call or e-mail us. We’re happy to answer any questions and help with your search.

This post originally appeared on the Windermere blog.

Local Market Update March 18, 2019

Local Market Update – March 2019

The spring home buying season started early this year. Open houses had increased attendance and bidding wars returned. After months of softening, home prices in most of the region jumped significantly from the prior month. With just one month of data, we’ll have to wait and see if this is the start of a longer upward trend.

King County

>>>Click image to view full report.


The median single-family home in King County sold for $655,000 in February. While up slightly less than 1 percent year-over-year, it was an increase of $45,000 over January. Southeast King County, which includes Kent, Renton and Auburn, saw the greatest gains with prices rising 4.5 percent over the previous year. While inventory has grown, it is less than half of the four to six months that is considered balanced.

Eastside

>>>Click image to view full report.


The Eastside was one area of King County that continued to see prices moderate. The median price of a single-family home on the Eastside was $900,000 in February, a drop of 5 percent from a year ago and down slightly from last month. However, supply here isn’t nearly enough to meet demand, a fact that most likely won’t change any time soon. Amazon’s latest expansion in Bellevue is expected to bring a significant wave of new employees to the city.

Seattle

>>>Click image to view full report.


More inventory and low interest rates helped bring buyers back into the market. The median price of a single-family home in Seattle hit $730,000 in February, down 6 percent from a year ago, but up $18,500 from January. With just six weeks of available supply, Seattle continues to have the tightest inventory in the county. Seattle’s record development boom shows little signs of easing, so we can expect strong demand to continue.

Snohomish County

>>>Click image to view full report.


The median price of a single-family home in Snohomish County reached $474,947 in February. Although that is a 2 percent decrease from last year, it is $5,000 more than January. As buyers push outside of King County to search for more reasonably priced homes, Snohomish County continues to struggle to find enough inventory to meet growing demand.

This post originally appeared on the WindermereEastside.com Blog.

Local Market Update February 15, 2019

Local Market Update – February 2019

January brought more good news for homebuyers. Prices were down, inventory was up and interest rates hovered near a nine-month low. Those factors drove more buyers into the market and resulted in an uptick in sales for the month. We’ll see how this transitioning market evolves as we head into the prime Spring home buying season.

King County

>>>Click image to view full report.

January marked the first time home prices in King County decreased year-over-year in seven years. The median price of a single-family home was $610,0000, a drop of 3 percent over the prior year. Inventory more than doubled. Unlike recent months, this was due primarily to more people putting their homes on the market, as opposed to homes taking longer to sell. Despite the surge in listings there is just two months of available inventory, far short of what is needed to meet demand.

Eastside

>>>Click image to view full report.

The most expensive region in King County saw prices soften in January. The median price of a single-family home on the Eastside dropped 3 percent over last January to $910,000. It’s an excellent time for buyers to leverage the cooling market and negotiate terms that work best for their needs. Last January, 39 percent of the homes in this area sold for over asking price. This January, that figure dropped to 12 percent. With its favorable business climate and high rankings for both economic growth and technology capabilities, demand on the Eastside is projected to remain strong.

Seattle

>>>Click image to view full report.

The median price of a single-family home in the city was $711,500 in January, a decrease of 6 percent year-over-year. Despite a 107 percent increase in homes for sale compared to a year ago, Seattle continues to have the tightest inventory in King County with less than two months of supply. A booming economy that shows no signs of slowing continues to draw more people to the city. The area will have to significantly add more inventory to meet that growing demand.

Snohomish County

>>>Click image to view full report.

The median price of a single-family home in January inched up 1 percent from last year to $455,000. That price is down from the median of $470,000 recorded in December. Snohomish County also saw a surge in inventory with the number of homes on the market double of what it was last year at this time.

This post originally appeared on the WindermereEastside.com Blog.

gardner report January 29, 2019

The Gardner Report – Fourth Quarter 2018

The following analysis of the Western Washington real estate market is provided by Windermere Real Estate Chief Economist Matthew Gardner. We hope that this information may assist you with making better-informed real estate decisions. For further information about the housing market in your area, please don’t hesitate to contact us.

Economic Overview

The Washington State economy continues to add jobs at an above-average rate, though the pace of growth is starting to slow as the business cycle matures. Over the past 12 months, the state added 96,600 new jobs, representing an annual growth rate of 2.9% — well above the national rate of 1.7%. Private sector employment gains continue to be quite strong, increasing at an annual rate of 3.6%. Public sector employment was down 0.3%. The strongest growth sectors were Real Estate Brokerage and Leasing (+11.4%), Employment Services (+10.3%), and Residential Construction (+10.2%). During fourth quarter, the state’s unemployment rate was 4.3%, down from 4.7% a year ago.

My latest economic forecast suggests that statewide job growth in 2019 will still be positive but is expected to slow. We should see an additional 83,480 new jobs, which would be a year-over-year increase of 2.4%.

Home Sales Activity

  • There were 17,353 home sales during the fourth quarter of 2018. Year-over-year sales growth started to slow in the third quarter and this trend continued through the end of the year. Sales were down 16% compared to the fourth quarter of 2017.
  • The slowdown in home sales was mainly a function of increasing listing activity, which was up 38.8% compared to the fourth quarter of 2017 (continuing a trend that started earlier in the year). Almost all of the increases in listings were in King and Snohomish Counties. There were more modest increases in Pierce, Thurston, Kitsap, Skagit, and Island Counties. Listing activity was down across the balance of the region.
  • Only two counties—Mason and Lewis—saw sales rise compared to the fourth quarter of 2017, with the balance of the region seeing lower levels of sales activity.
  • We saw the traditional drop in listings in the fourth quarter compared to the third quarter, but I fully anticipate that we will see another jump in listings when the spring market hits. The big question will be to what degree listings will rise.

Home Prices

  • With greater choice, home price growth in Western Washington continued to slow in fourth quarter, with a year-over-year increase of 5% to $486,667. Notably, prices were down 3.3% compared to the third quarter of 2018.

  • Home prices, although higher than a year ago, continue to slow. As mentioned earlier, we have seen significant increases in inventory and this will slow down price gains. I maintain my belief that this is a good thing, as the pace at which home prices were rising was unsustainable.

  • When compared to the same period a year ago, price growth was strongest in Skagit County, where home prices were up 13.7%. Three other counties experienced double-digit price increases.

  • Price growth has been moderating for the past two quarters and I believe that we have reached a price ceiling in many markets. I would not be surprised to see further drops in prices across the region in the first half of 2019, but they should start to resume their upward trend in the second half of the year.

Days on Market

  • The average number of days it took to sell a home dropped three days compared to the same quarter of 2017.

  • Thurston County joined King County as the tightest markets in Western Washington, with homes taking an average of 35 days to sell. There were eight counties that saw the length of time it took to sell a home drop compared to the same period a year ago. Market time rose in five counties and was unchanged in two.
  • Across the entire region, it took an average of 51 days to sell a home in the fourth quarter of 2018. This is down from 54 days in the fourth quarter of 2017 but up by 12 days when compared to the third quarter of 2018.

  • I suggested in the third quarter Gardner Report that we should be prepared for days on market to increase, and that has proven to be accurate. I expect this trend will continue, but this is typical of a regional market that is moving back to becoming balanced.

Conclusions

This speedometer reflects the state of the region’s real estate market using housing inventory, price gains, home sales, interest rates, and larger economic factors. I am continuing to move the needle toward buyers as price growth moderates and listing inventory continues to rise.

2019 will be the year that we get closer to having a more balanced housing market. Buyer and seller psychology will continue to be significant factors as home sellers remain optimistic about the value of their home, while buyers feel significantly less pressure to buy. Look for the first half of 2019 to be fairly slow as buyers sit on the sidelines waiting for price stability, but then I do expect to see a more buoyant second half of the year.


As Chief Economist for Windermere Real Estate, Matthew Gardner is responsible for analyzing and interpreting economic data and its impact on the real estate market on both a local and national level. Matthew has over 30 years of professional experience both in the U.S. and U.K.

In addition to his day-to-day responsibilities, Matthew sits on the Washington State Governors Council of Economic Advisors; chairs the Board of Trustees at the Washington Center for Real Estate Research at the University of Washington; and is an Advisory Board Member at the Runstad Center for Real Estate Studies at the Unversity of Washington where he also lectures in real estate economics.

This post originally appeared on the Windermere.com Blog.

Local Market Update January 18, 2019

Local Market Update – January 2019

A cool-down in prices and a surge in inventory spelled out good news for buyers in December. Median home prices throughout the region continued to moderate. The number of homes for sale more than doubled over a year ago. Condo inventory more than quadrupled. While we’re still far short of the four to six months that are considered a balanced market, December moved us closer in that direction. As winter months traditionally bring slower sales and lower prices, we’ll be able to determine a more solid trend when the peak real estate season comes this spring.

King County

>>>Click image to view full report.

In December, the median price of a single-family King County home was $639,000. That is 0.6 percent more than the same time last year and a welcome respite from the double-digit increases we saw for much of 2018. Inventory was up as well, soaring 143 percent from a year prior. The trend toward a more balanced market is good news for buyers. Instead of having to make a decision in a matter of hours, buyers now can take the time to consider their options and negotiate a price and terms that work best for them.

Eastside

>>>Click image to view full report.

The number of single-family homes and condos on the market in December tripled as compared to a year ago on the Eastside. With an abundance of choices for buyers, homes here took longer to sell. However, well-priced homes still sold within weeks rather than days, which was the case earlier in the year. As with all of King County, home prices here continued to moderate. The median price of a single-family home was $909,000. That’s down 3 percent from a year ago, but up from November’s median price of $885,000.

Seattle

>>>Click image to view full report.

Last December there were only 299 homes on the market in Seattle. This December there were 1,111. Despite the sharp uptick, Seattle has the tightest inventory in King County with less than two months of supply. Demand is predicted to stay high in 2019. With an abundance of high-paying jobs and not enough people to fill them, Seattle’s population is expected to grow at twice the national rate this year. Prices have continued to moderate from the unsustainable increases of last year. The median price of a single-family home inched up 2 percent from the year prior to $739,000.

Snohomish County

>>>Click image to view full report.

The median price of a single-family home was up 4 percent from last year to $470,000 in December – the same price the area posted the previous month. Inventory has more than doubled in the past year due to more sellers listing their homes and fewer sales. However, at 2.6 months of supply the area has a long way to go before becoming a balanced market.

This post originally appeared on the WindermereEastside.com Blog.

buyinghome decorreal estateselling January 4, 2019

Investing In a Green Home Will Pay Dividends In 2019

As we step forward into 2019, eco-friendly “green homes” are more popular than ever. Upgrading your home’s sustainability improves quality of life for those residing in it, but it is also a savvy long-term investment. As green homes become more popular, properties boasting sustainable features have become increasingly desirable targets for homebuyers. Whether designing a new home from scratch or preparing your current home for sale, accentuating a house with environmentally-friendly features can pay big dividends for everyone.

While the added value depends on the location of the home, its age, and whether it’s certified or not, three separate studies all found that newly constructed, Energy Star, or LEED-certified homes typically sell for about nine percent more than comparable, non-certified new homes. Plus, one of those studies discovered that existing homes retrofitted with green technologies, and certified as such, can command a whopping 30-percent sales-price boost.

There are dozens of eco-friendly features that can provide extra value for you as a seller. To name a few:

Cool roof

Cool roofs keep the houses they’re covering as much as 50 to 60 degrees cooler by reflecting the heat of the sun away from the interior, allowing the occupants to stay cooler and save on air-conditioning costs. The most common form is metal roofing. Other options include roof membranes and reflective asphalt shingles.

Fuel cells

Fuel cells may soon offer an all-new source of electricity that would allow you to completely disconnect your home from all other sources of electricity. About the size of a dishwasher, a fuel cell connects to your home’s natural gas line and electrochemically converts methane to electricity. One unit would pack more than enough energy to power your whole home.

For many years, fuel cells have been far too expensive or unreliable. But as technology has improved, so too has reliability. Companies like Home Power Solutions and Redbox Power Systems have increased the reliability of these fuel sources while reducing their size. Much like we’ve seen computers and cell phones shrink in size while improving reliability and power, fuel cells continue to be refined.

Wind turbine

A wind turbine (essentially a propeller spinning atop an 80- to 100-foot pole) collects kinetic energy from the wind and converts it to electricity for your home. And according to the Department of Energy, a small version can slash your electrical bill by 50 to 90 percent.

But before you get too excited, you need to know that the zoning laws in most urban areas don’t allow wind turbines. They’re too tall. The best prospects for this technology are homes located on at least an acre of land, well outside the city limits.

Green roof

Another way to keep the interior of your house cooler—and save on air-conditioning costs—is to replace your traditional roof with a layer of vegetation (typically hardy groundcovers). This is more expensive than a cool roof and requires regular maintenance, but young, environmentally conscious homeowners are very attracted to the concept.

Hybrid heating

Combining a heat pump with a standard furnace to create what’s known as a “hybrid heating system” can save you somewhere between 15 and 35 percent on your heating and cooling bills.

Unlike a gas or oil furnace, a heat pump doesn’t use any fuel. Instead, the coils inside the unit absorb whatever heat exists naturally in the outside air, and distributes it via the same ductwork used by your furnace. When the outside air temperature gets too cold for the heat pump to work, the system switches over to your traditional furnace.

Geothermal heating

Geothermal heating units are like heat pumps, except instead of absorbing heat from the outside air, they absorb the heat in the soil next to your house via coils buried in the ground. The coils can be buried horizontally or, if you don’t have a wide enough yard, they can be buried vertically. While the installation price of a geothermal system can be several times that of a hybrid, air-sourced system, the cost savings on your energy bills can cover the installation costs in five to 10 years.

Solar power

Solar panels capture light energy from the sun and convert it directly into electricity. Similarly to wind turbines, your geographical location may determine the feasibility of these installments. Even on cloudy days, however, solar panels typically produce 10-25% of their maximum energy output. For decades, you may have seen these panels sitting on sunny rooftops all across America. But it’s only recently that this energy-saving option has become truly affordable.

In 2010, installing a solar system on a typical mid-sized house would have set the homeowner back $30,000. But as of December 2018, the average cost after tax credits for solar panel installation was just $13,188! Plus, some companies are now offering to rent solar panels to homeowners (the company retains ownership of the panels and sells the homeowner access to the power at roughly 10 to 15 percent less than they would pay their local utility).

Solar water heaters

Rooftop solar panels can also be used to heat your home’s water. The Environmental Protection Agency estimates that the average homeowner who makes this switch should see their water bills shrink by 50 to 80 percent.

Tax credits/rebates

Many of the innovative solutions summarized above come with big price tags attached. However, federal, state and local rebates/tax credits can often slash those expenses by as much as 50 percent. So before ruling any of these ideas out, take some time to see which incentives you may qualify for at dsireusa.org and the “tax incentives” pages at Energy.Gov.

Regardless of which option you choose, these technologies will help to conserve valuable resources and reduce your monthly utility expenses. Just as importantly, they will also add resale value that you can leverage whenever you decide it’s time to sell and move on to a new home.

This post originally appeared on the Windermere.com blog.

Local Market Update December 13, 2018

Local Market Update – December 2018

The real estate market continued to improve for buyers in November. Interest rates dropped slightly, price increases slowed and inventory soared. It’s important to note that inventory increases, while significant, are being compared to the record low supply of last year. We’re still far short of the inventory needed for a truly balanced market, however buyers have greater choice and less competition than they’ve had in years. Sellers who price their home according to current market conditions continue to see strong interest. Heading into the holiday season, there’s something for everyone to celebrate.

King County

>>>Click image to view full report.

Price increases continued to slow in King County. The median single-family home price was $643,913 in November, an increase of 2 percent over a year ago. South King County, where the most affordable homes in the county are located, saw significantly greater increases compared to a year ago. North King County also posted greater increases than the county overall. Inventory has skyrocketed as the number of homes for sale in King County more than doubled year-over-year. While that’s good news for buyers, there is only 2.1 months of available inventory in the county, slightly down from October and not nearly enough to meet demand.

Eastside

>>>Click image to view full report.

The Eastside economy continues to be very strong. Heavy investment in commercial construction from companies such as Vulcan boost expectations that the area will continue to thrive. The median price of a single-family home in November hit $885,000 on the Eastside. Although an increase of 4 percent from a year ago, home prices have remained steady since this fall. With continued demand and only 2.4 months of inventory, the market has a long way to go to becoming balanced.

Seattle

>>>Click image to view full report.

The median price of a single-family home in Seattle was $760,000 in November. This is up 3 percent from a year ago and slightly up from October. Inventory jumped 177 percent year-over-year however, at just two months of supply, the Seattle area has the tightest inventory in King County. With the city’s strong economy and lifestyle appeal, that’s not expected to change any time soon. Forbes recently named Seattle as the best place for business and careers in the nation. U.S. News & World Report ranked the University of Washington among the top ten universities in the world with Money Magazine rating Seattle the #5 Best Big City to Live In.

Snohomish County

>>>Click image to view full report.

Inventory in Snohomish County continued to climb, surging 88 percent in November as compared to a year ago. That said, the area has fewer homes for sale than King County with just 1.8 months of inventory. This is still far short of the four to six months of supply that is considered a balanced market. The median price of a single-family home sold in November was up 6 percent from last year to $470,000, virtually unchanged from October.

This post originally appeared on the WindermereEastside.com blog.

buyingselling November 27, 2018

Where Are Home Prices Headed?


Home price increases in the Puget Sound area have started to moderate. While down from the unsustainable highs of this spring, prices continue to be up compared to a year ago. So, where are home prices headed next?

The Home Price Expectation Survey checks in with over 100 national real estate experts every quarter, including Windermere Chief Economist Matthew Gardner. Here’s where they think prices will go:

Gardner predicts our local market will fare better than the nation overall.

“As I look to 2019, I believe home prices in King County will increase 7.8% over the current year.”
– Windermere Chief Economist Matthew Gardner

“The local economy will continue to grow and that will drive demand for ownership housing,” according to Gardner. “Supply will slow during the holiday season before we see a new influx of listings in the spring. With more supply, I believe that home price growth will continue to slow, but values will still increase.”

Whether you’re thinking of buying or selling we can provide you with market data that will help you make the best decision for your circumstances.